Skip to content
 Executive Summary
Most IAM reports still measure activity instead of impact. They showcase volumes, including accounts created, logins, tickets closed, etc., without demonstrating whether those efforts reduce real risk. To build executive confidence and satisfy auditors, IAM reporting must pivot from operational counts to risk-focused KPIs that prove whether key controls actually work. This document defines a practical approach to measuring control efficacy and introduces five IAM KPIs that speak the language of risk reduction and business outcomes.
Why Activity Metrics Fall Short
Operational metrics are useful for running day-to-day IT operations, but they rarely explain the security posture. Counting events (e.g., number of accounts provisioned) can hide systemic exposure, leaving leaders without a clear line of sight into threats such as credential theft, excessive privileges, and stale access.
What to Measure: Control Efficacy
Control efficacy is the proof that a control accomplishes its intended purpose. Instead of assuming a process works, we measure whether the control demonstrably reduces the targeted risks. For example, whether multi-factor authentication actually shields identities from takeover, or whether deprovisioning truly removes access fast enough to limit insider risk.
Operational Metrics vs. Risk KPIs
Operational Metrics — Descriptive data used to manage IT execution (e.g., count of standing privileged accounts). They are inputs, not proof of risk reduction.
Risk KPIs — Outcome-oriented measures tied to specific risks and controls, often expressed as percentages or time-to-action to show performance over time.
Three Practical Lenses for IAM Risk
- Identity exposure — Weak authentication or hygiene that increases account takeover risk.
- Authorization exposure — Excess or ungoverned privileges that expand the blast radius of incidents.
- Process exposure — Manual steps, delays, or inconsistent workflows that leave access active longer than necessary.
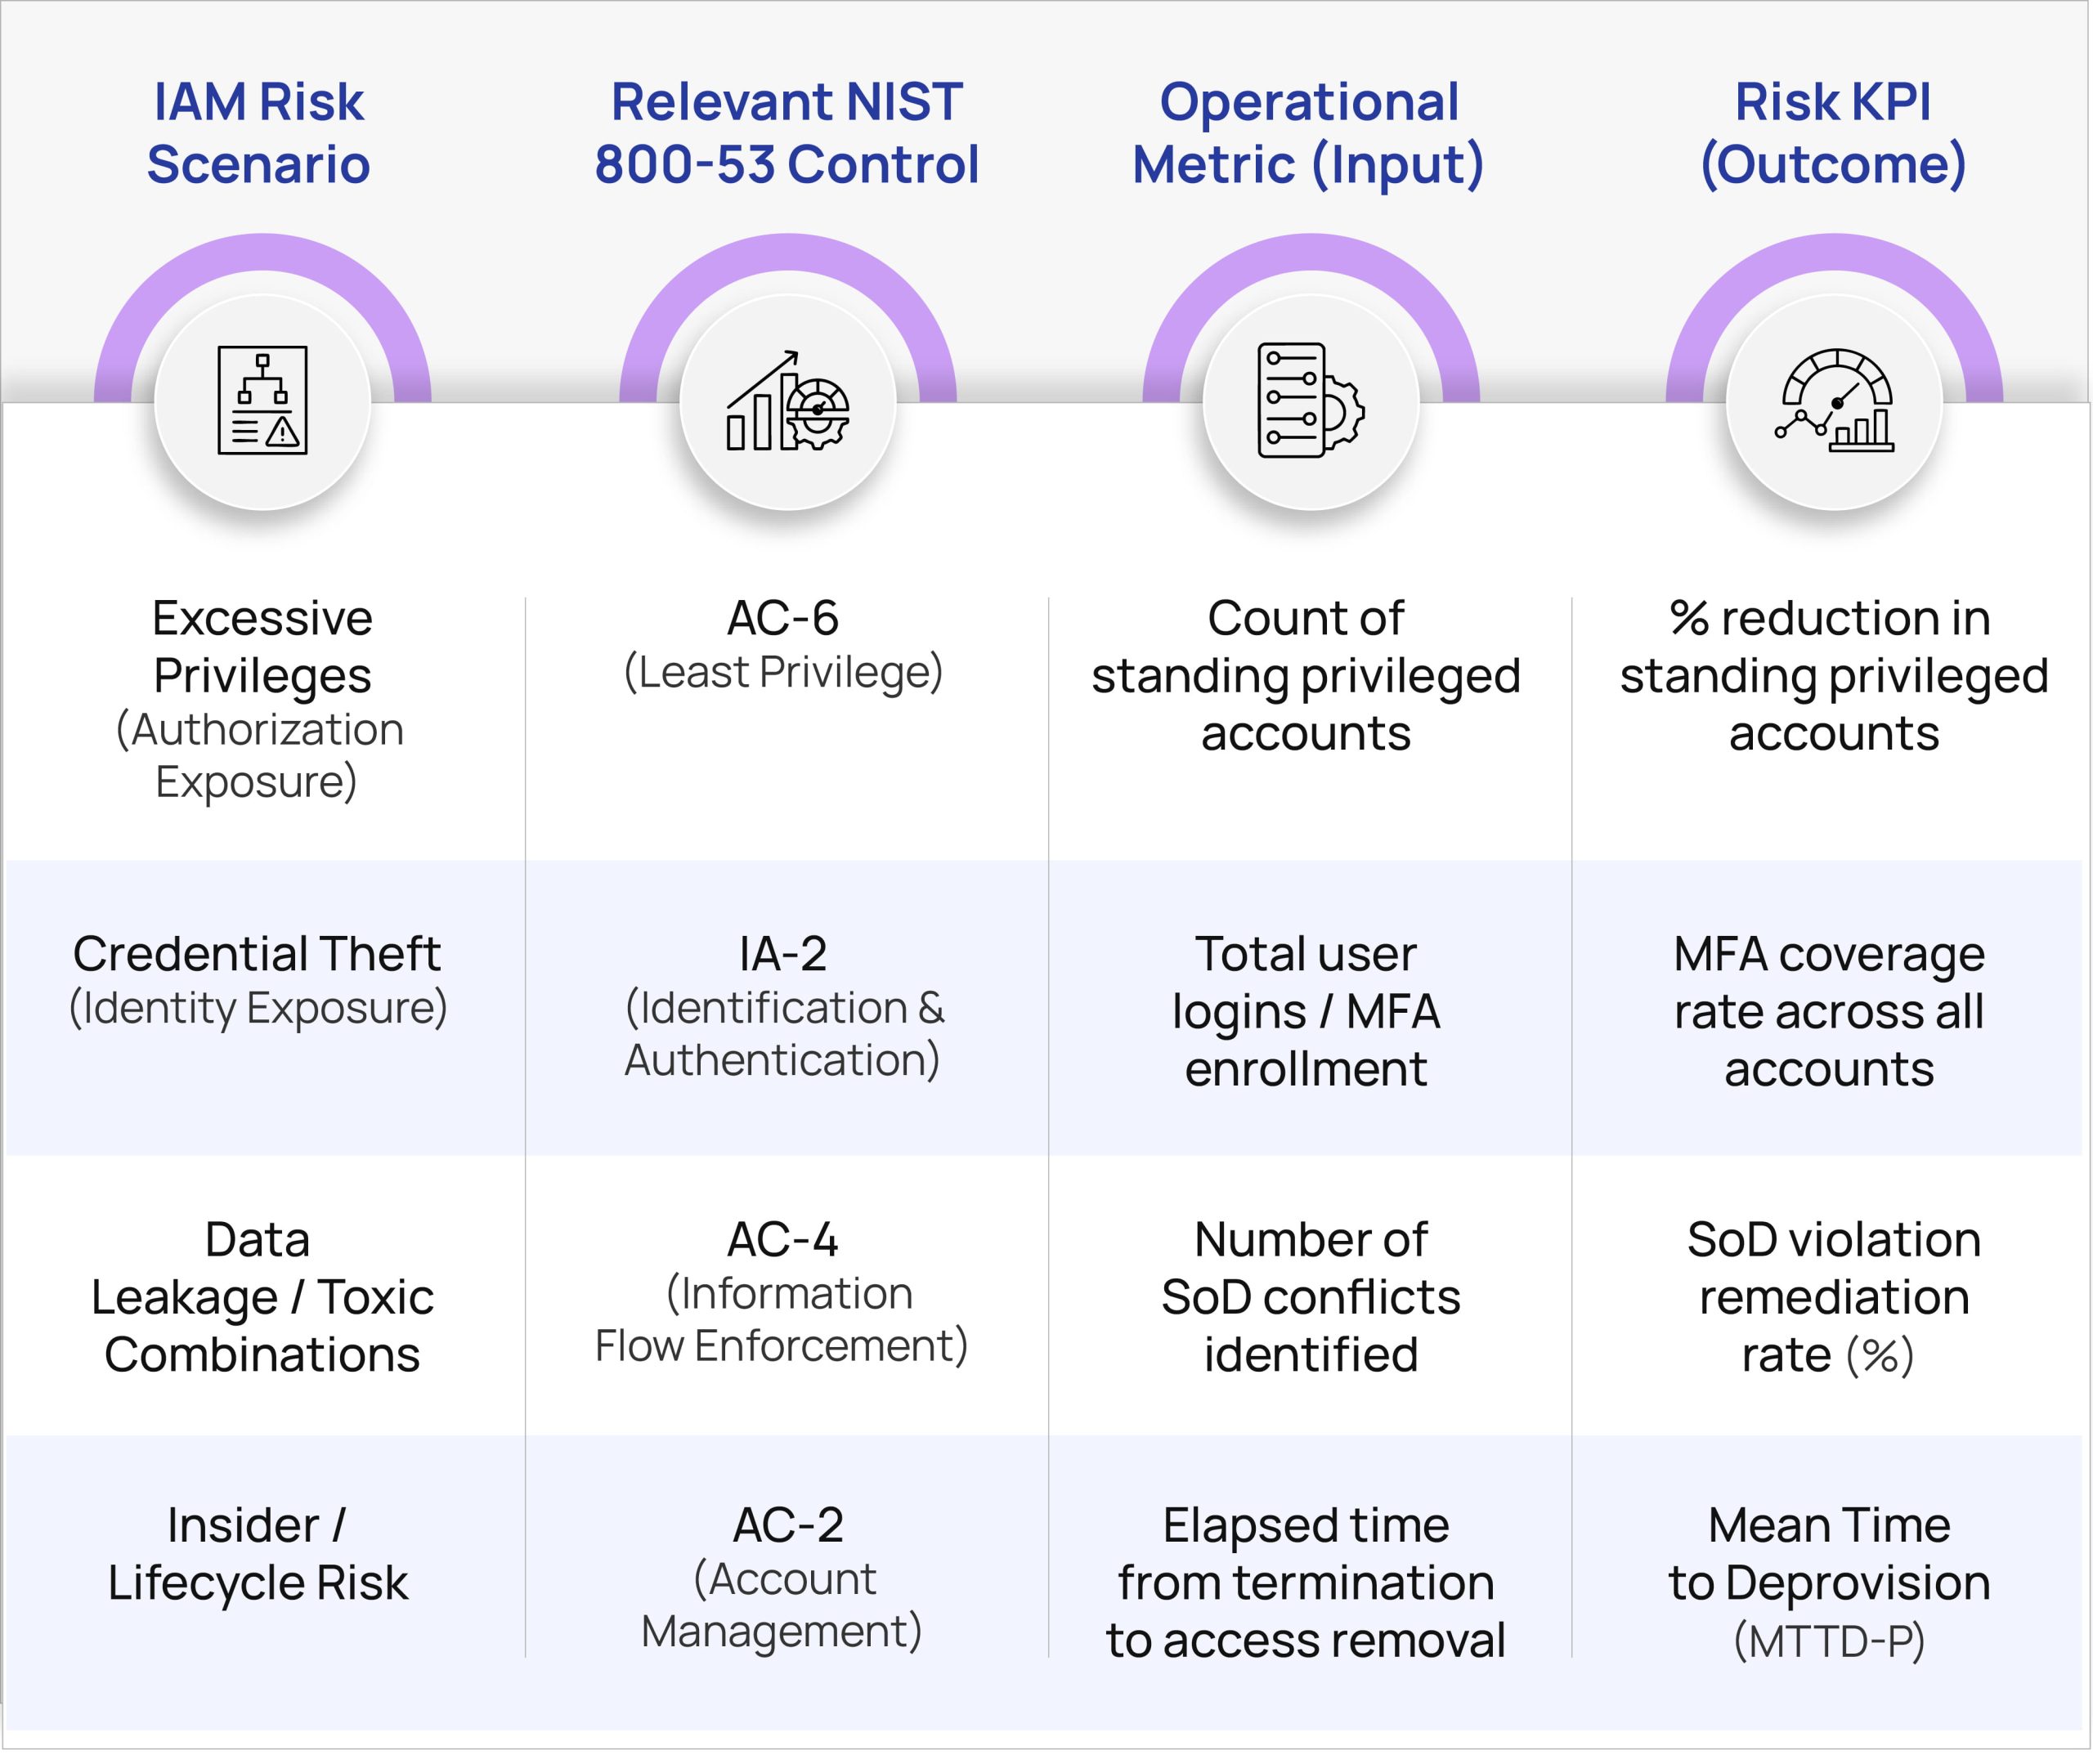
Linking KPIs to Governance Frameworks (NIST 800-53)
Risk-focused KPIs should align with established controls so that security outcomes map cleanly to compliance obligations. The examples below connect common IAM risk scenarios to NIST 800-53 controls and show how an operational metric becomes a risk KPI. Linking the risk scenario to the organization’s Infosec Policy and standards (in addition to NIST 800-53) will help bring shared clarity (across CXO, Middle Management, Risk Owners/Delegates, and Risk Remediators).
The Five IAM KPIs That Demonstrate Risk Reduction
1) Multi-Factor Authentication (MFA) Coverage
What it shows: Breadth of strong authentication across identities, a direct signal of resilience against credential theft.
Target: >99.5% overall coverage, with prioritized closure of gaps on privileged and high-risk apps.
Why it matters: Broad MFA drastically reduces the success rates of phishing and password-replay attacks.
2) Orphaned and Dormant Account Exposure
What it shows: Frequency of accounts that remain active without ownership or recent usage.
Target: Trending toward 0%; hard ceiling <1%.
Why it matters: Unmonitored accounts are easy footholds for lateral movement and data access.
3) Mean Time to Deprovision (MTTD-P)
What it shows: How quickly access is removed after workforce separation or role change.
Target: <4 hours for standard users; <1 hour for privileged roles.
Why it matters: Fast deprovisioning shrinks the window for insider misuse and audit findings.
4) Just-in-Time (JIT) Privileged Access Adoption
What it shows: The shift from standing admin rights to time-bound, request-based access.
Target: Adoption targets set by program maturity (e.g., % of admin scenarios served via JIT).
Why it matters: Reduces blast radius by minimizing constant high-risk privileges.
5) Access Review Completion (Compliance Health)
What it shows: Whether mandated certifications are completed within the required window.
Target: 100% on-time completion.
Why it matters: Proves governance discipline and closes gaps that accumulate between reviews.
Making the KPIs Operational
Ownership and Accountability: Assign a clear owner for each KPI, responsible for both measurement and remediation workflow. Build runbooks that define triggers and SLAs.
Automated Data Collection: Use IGA and PAM platforms to collect metrics continuously, as manual sampling creates blind spots and weakens audit defensibility.
Trend the Outcomes: Present KPIs as quarterly trends to show risk reduction over time and to justify investment. Start with achievable thresholds and raise the bar as controls harden.
First 90 Days: What to Instrument First
To gain immediate visibility and demonstrate momentum, instrument these controls first: (1) MFA Coverage, (2) Mean Time to Deprovision, and (3) Access Review Completion. Together, they reveal the strength of your preventive controls and your governance discipline.
Conclusion
When IAM reporting focuses on outcomes, leaders can see where risk is shrinking, where it persists, and which investments will have the greatest impact. These five KPIs translate technical activity into measurable risk reduction, positioning IAM as an operational enabler rather than a cost center.